At ENDEVR, we are reshaping the future of how environmental professionals evaluate, visualize and report data
RrAD Engine
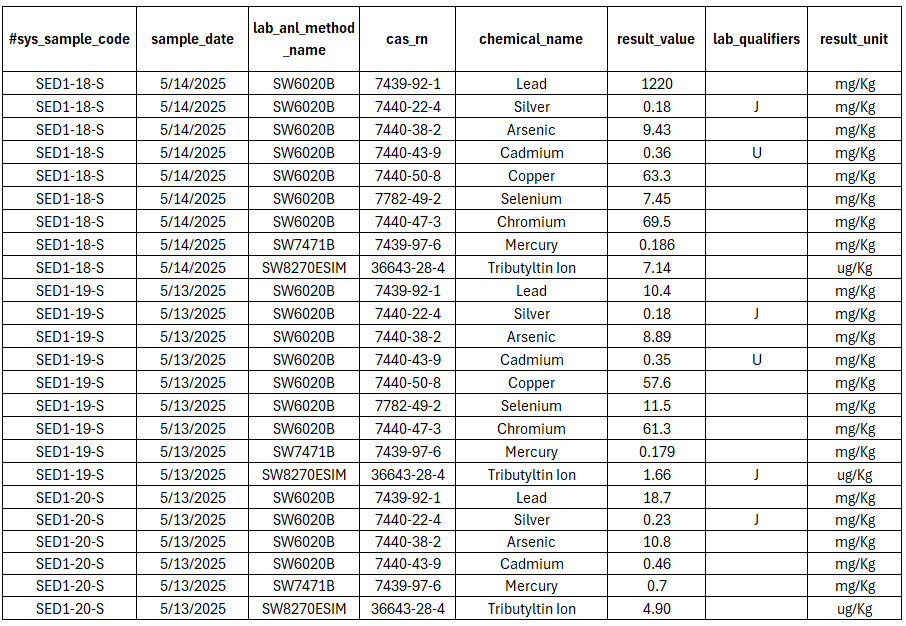
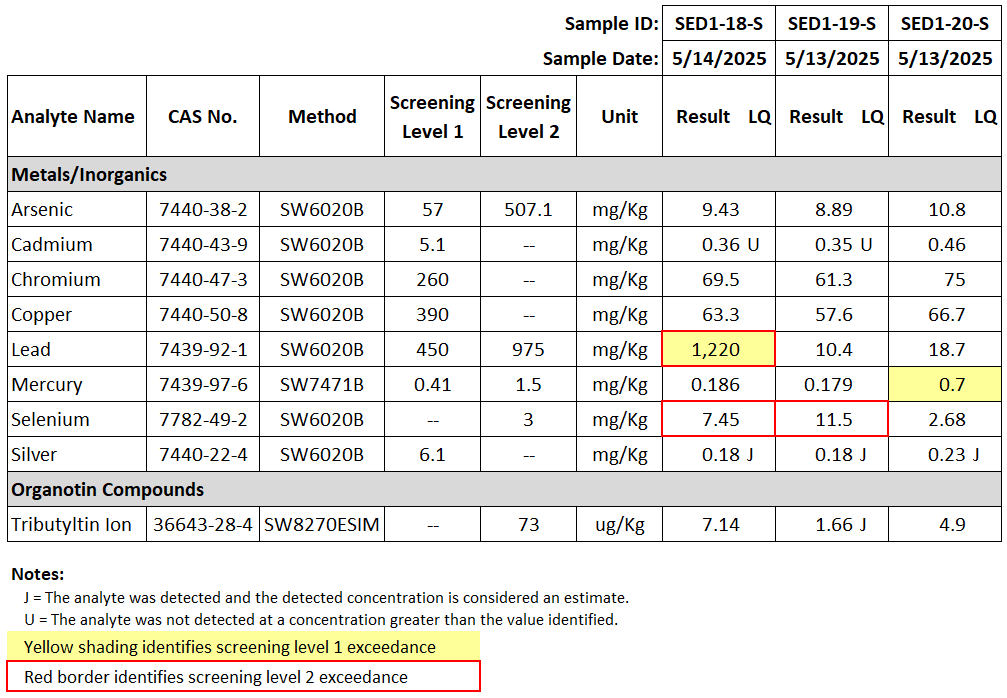
Using the Report-Ready Analytical Data (RrAD) Engine, you can perform calculations such as TEQs and data statistics, screen data against applicable standards, organize and format results, conduct preliminary QA/QC, and transform your raw environmental data into report-ready data tables.
Example Raw Environmental Data
 Click to enlarge
Example Report-Ready Analytical Data (RrAD) Table
 Click to enlarge
in a few simple steps...
1
2
3
4
5
Map
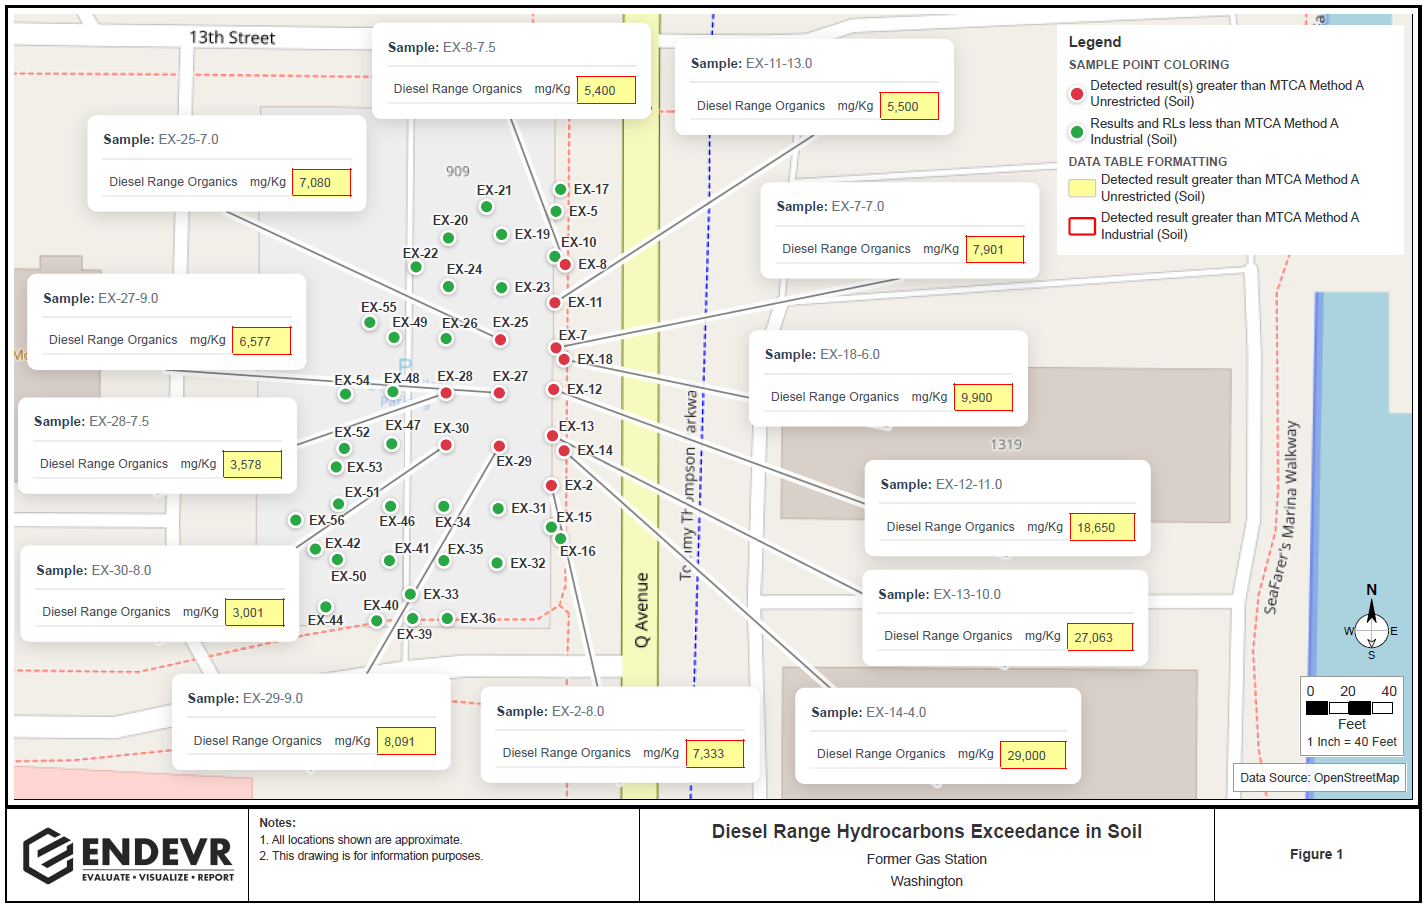
Using the Map tool, you can visualize your environmental data on an interactive map by simply uploading a RrAD Table with coordinates.
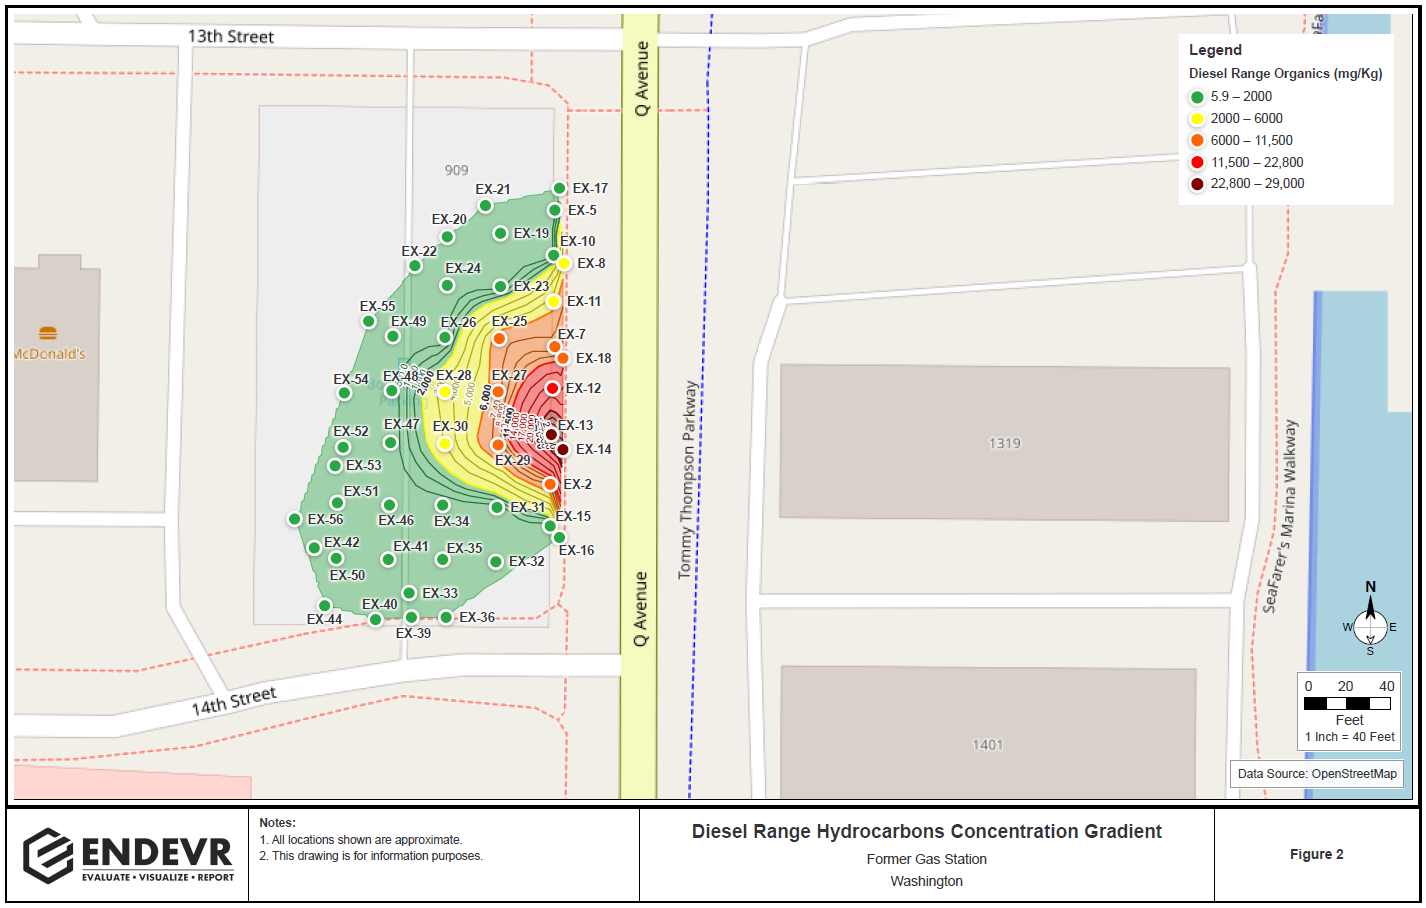
Filter data by screening criteria, matrix, analytes, depth, and date range to visualize exceedances at your site, build concentration gradient maps, explore data across depths and time in real time, and produce print-ready figures for reports or stakeholder communication — all with just a few clicks.
Example Exceedance Map
 Click to enlarge
Example Concentration Gradient Map
 Click to enlarge
×
![]()