Site investigation planning and post-data collection workflows
- simplified & automated
RrAD Engine
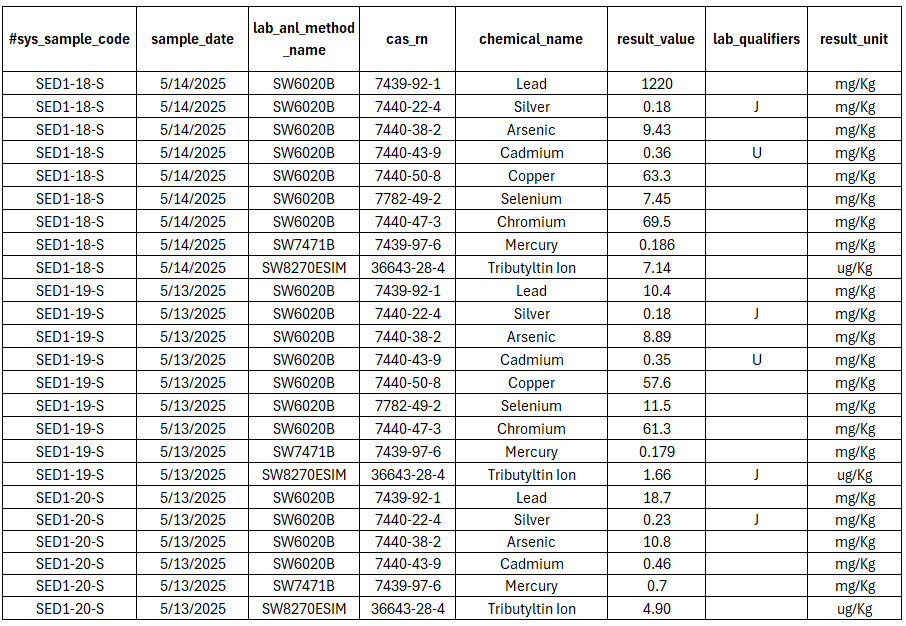
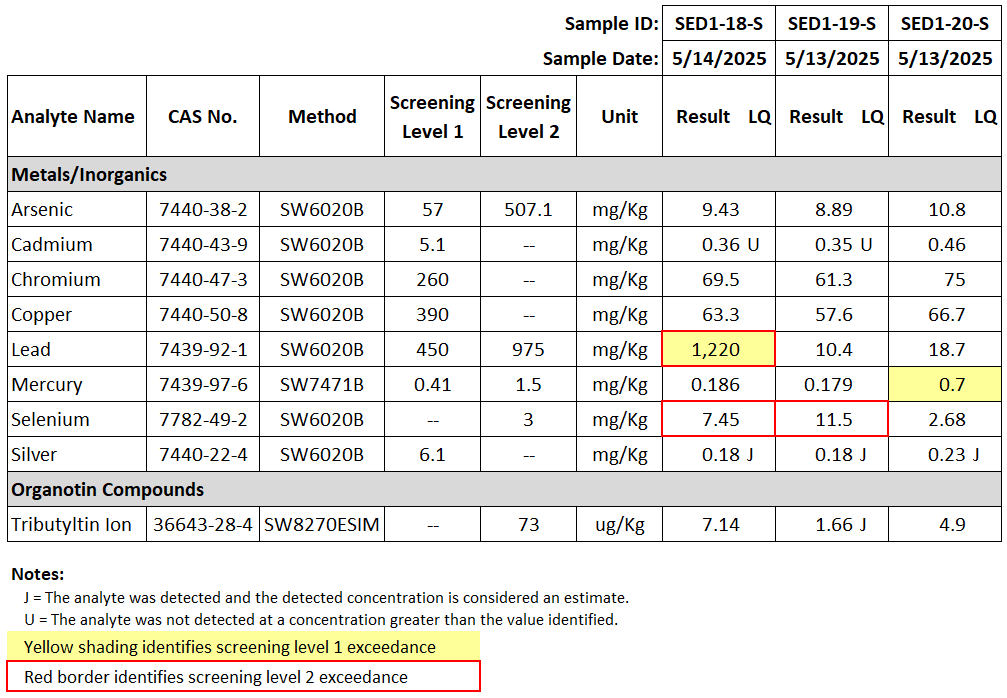
Using the Report-Ready Analytical Data (RrAD) Engine, you can perform calculations such as TEQs and data statistics, screen data against applicable standards, organize and format results, conduct preliminary QA/QC, and transform your raw environmental data into report-ready data tables...
Example Raw Environmental Data
 Click to enlarge
Example Report-Ready Analytical Data (RrAD) Table
 Click to enlarge
in a few simple steps...
1
2
3
4
5
Map
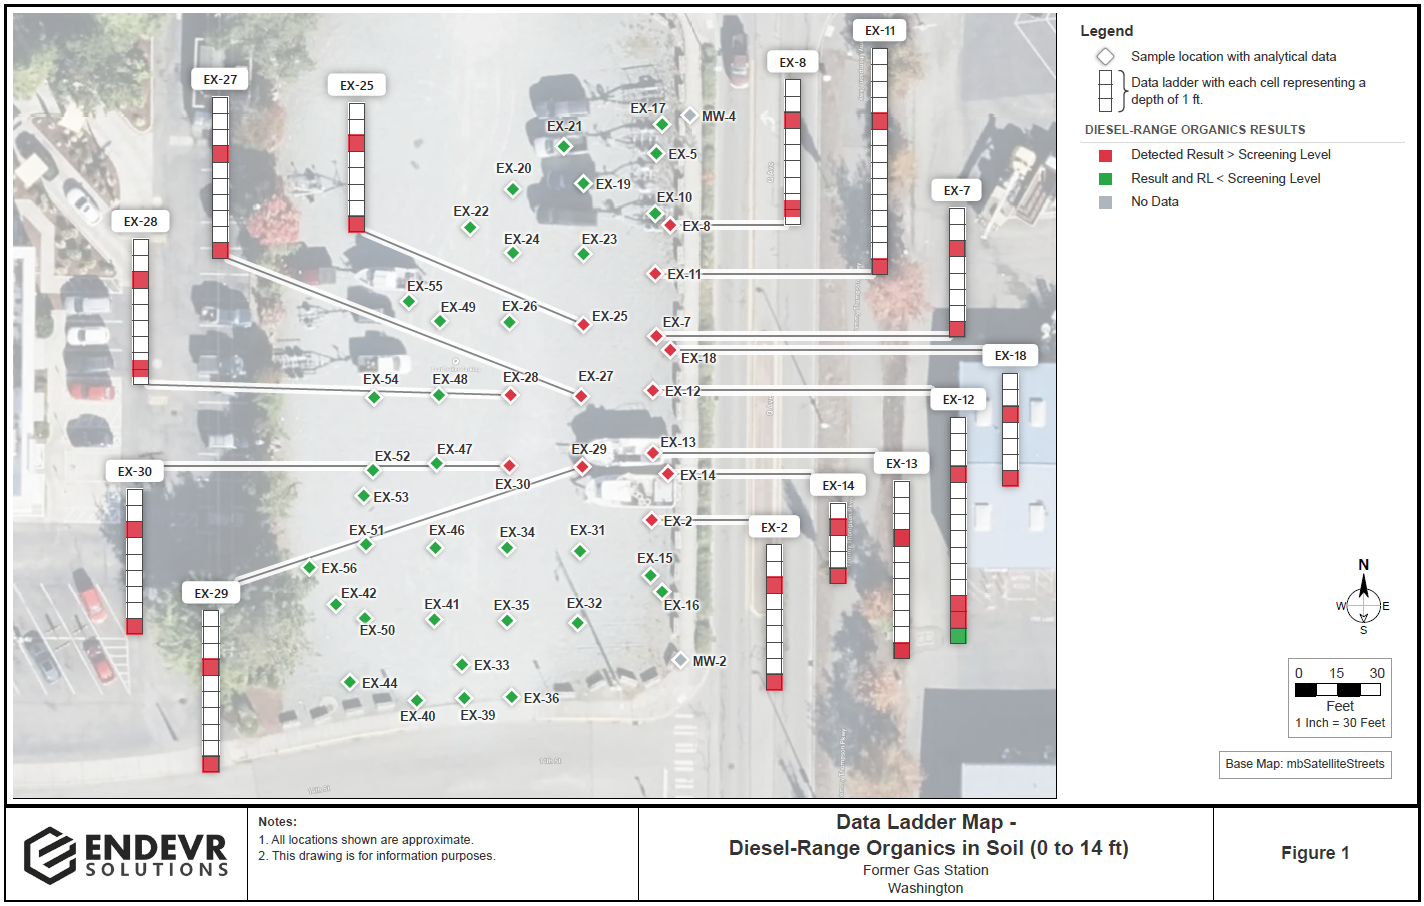
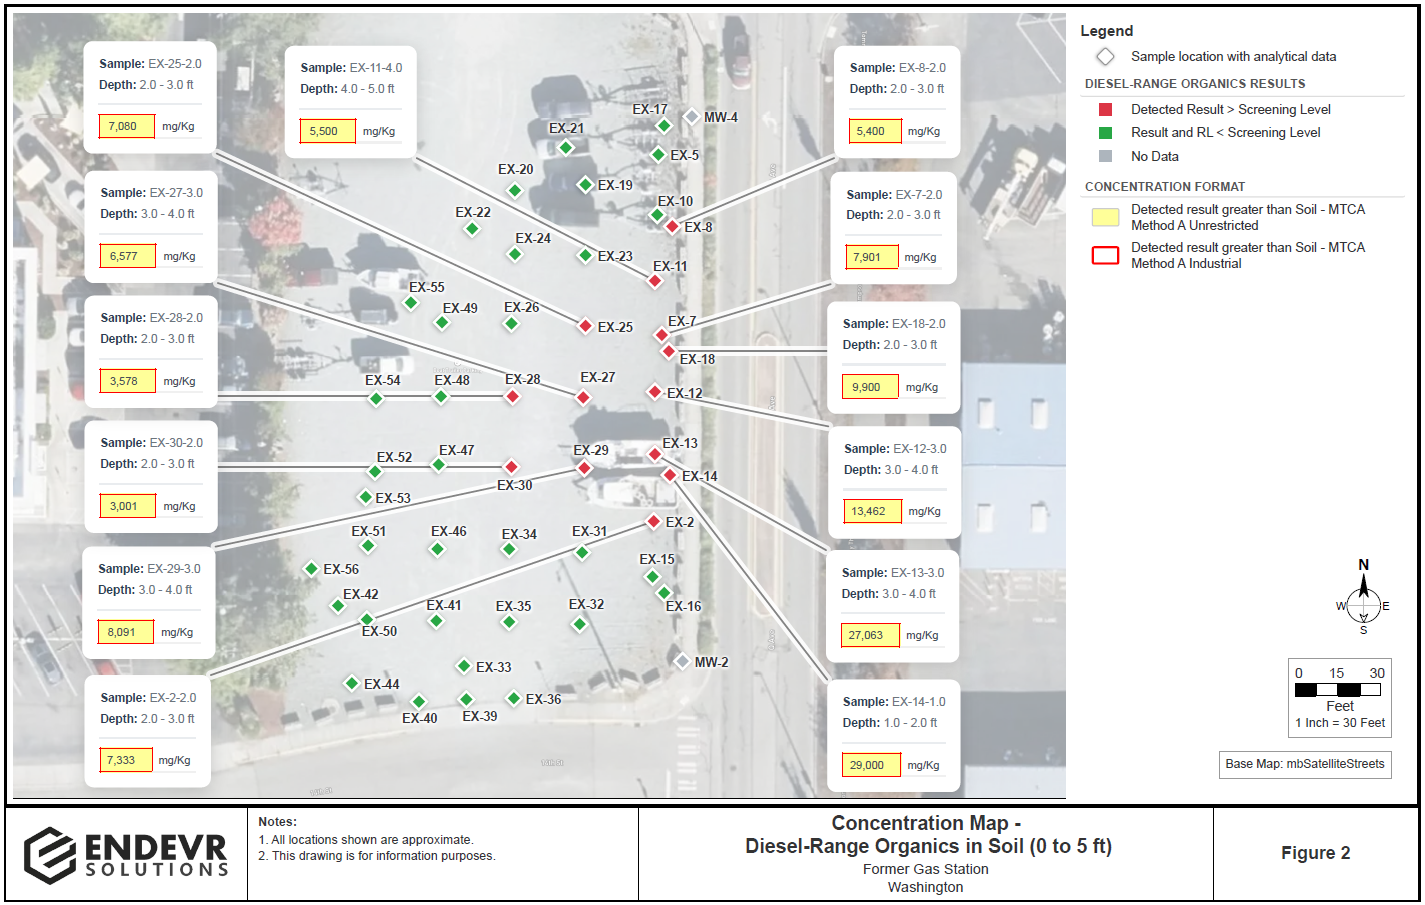
Using the Map tool, you can visualize your environmental data on a map by simply uploading the output of RrAD Engine, as well as plan your next site investigation directly on an interactive map.
Using map filters, dynamically visualize your site data across depths, dates, matrices and different contaminants of concern, and build report-ready figures instantaneously, no GIS or CAD skills required.
The following are some examples of how you can visualize your site data or plan site investigation using the Map tool.
Example Data Ladder Map
 Click to enlarge
Example Concentration Map
 Click to enlarge
Example Heat Map
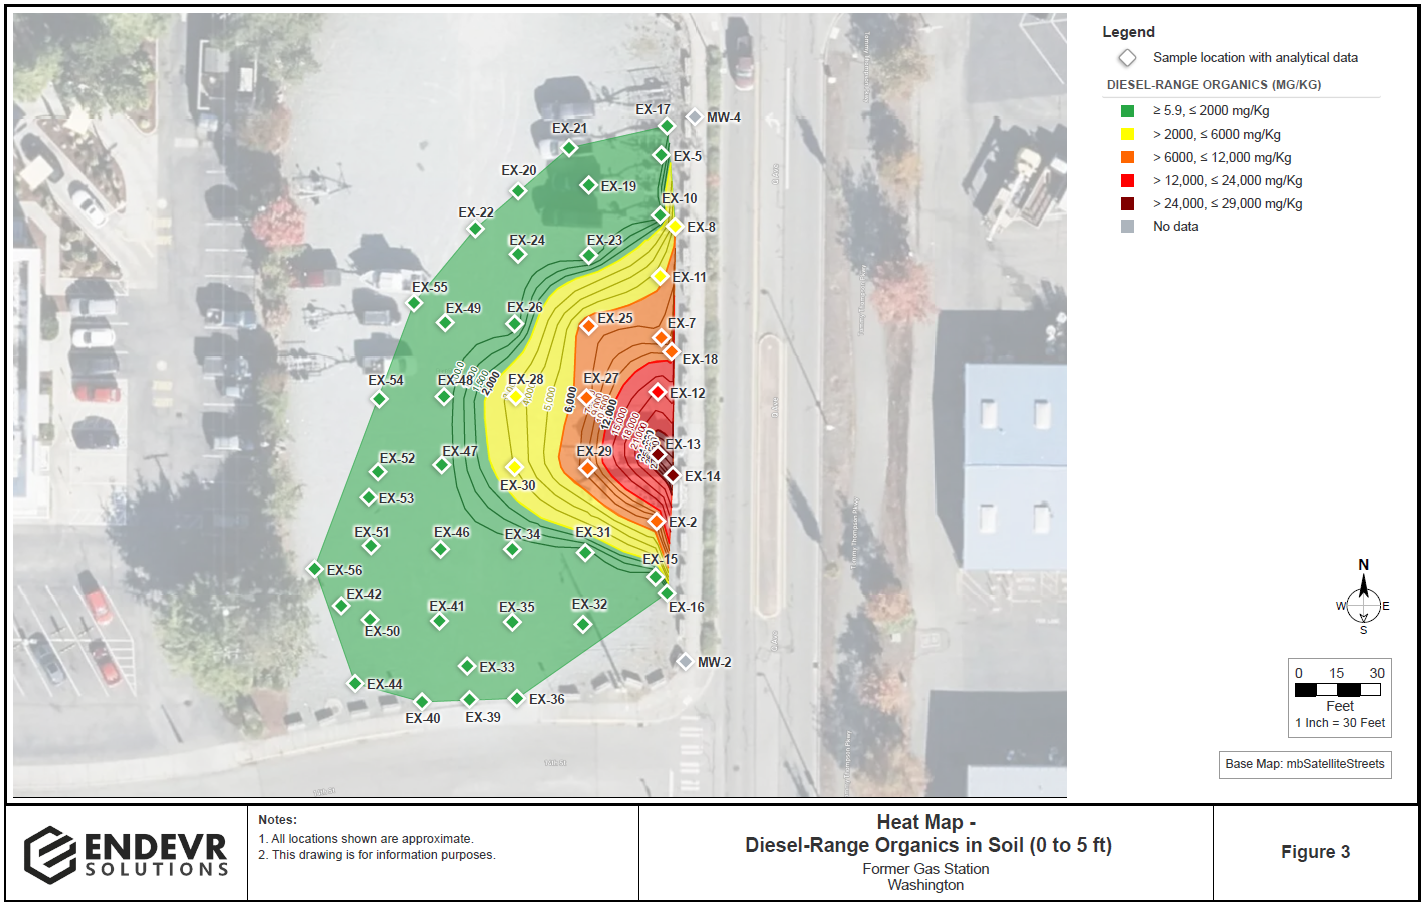 Click to enlarge
Example Pie Chart Map
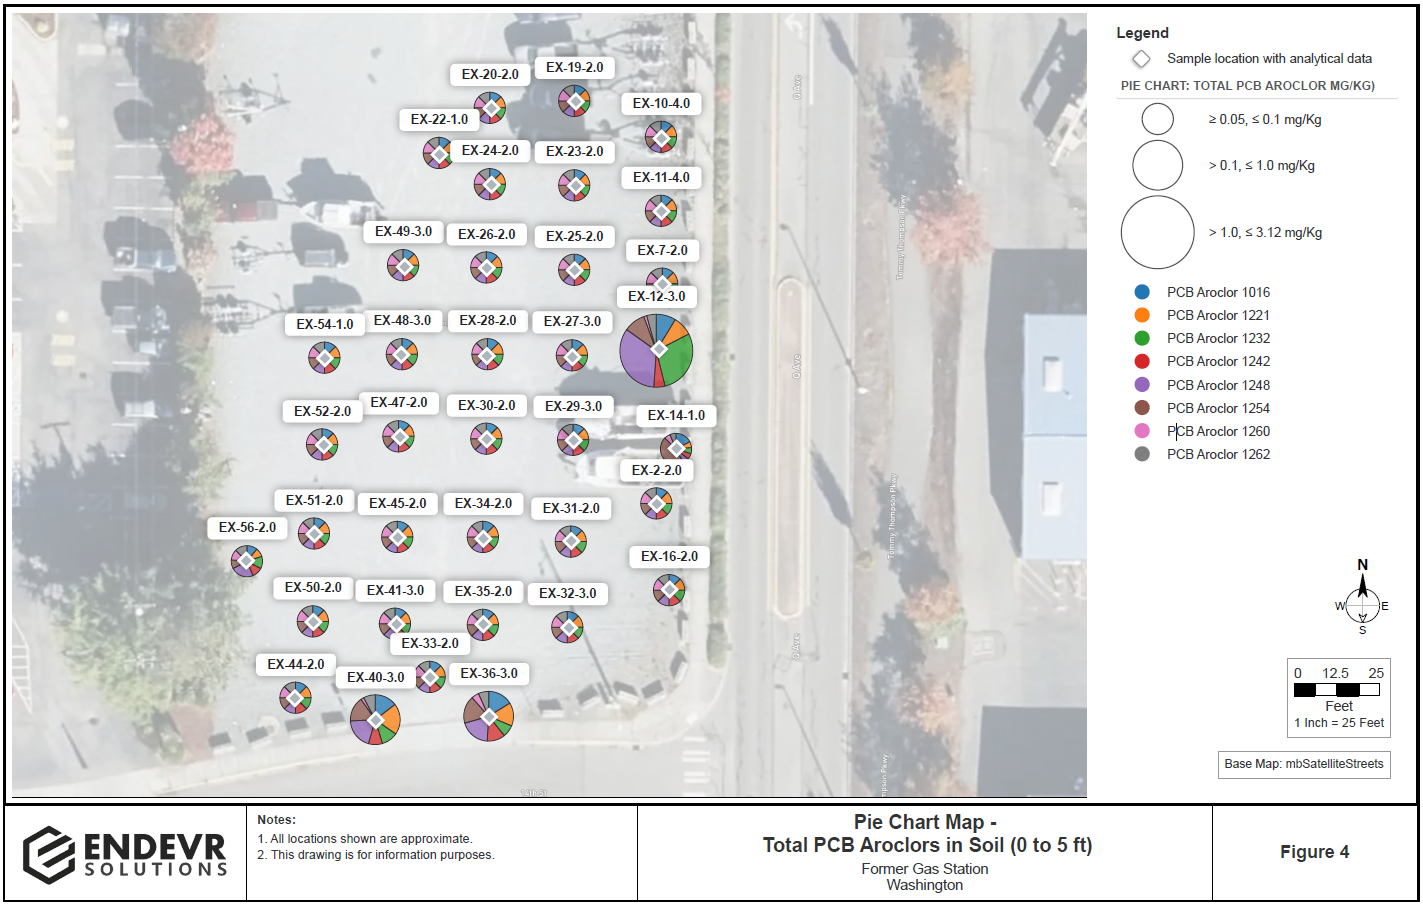 Click to enlarge
Example Investigation Plan
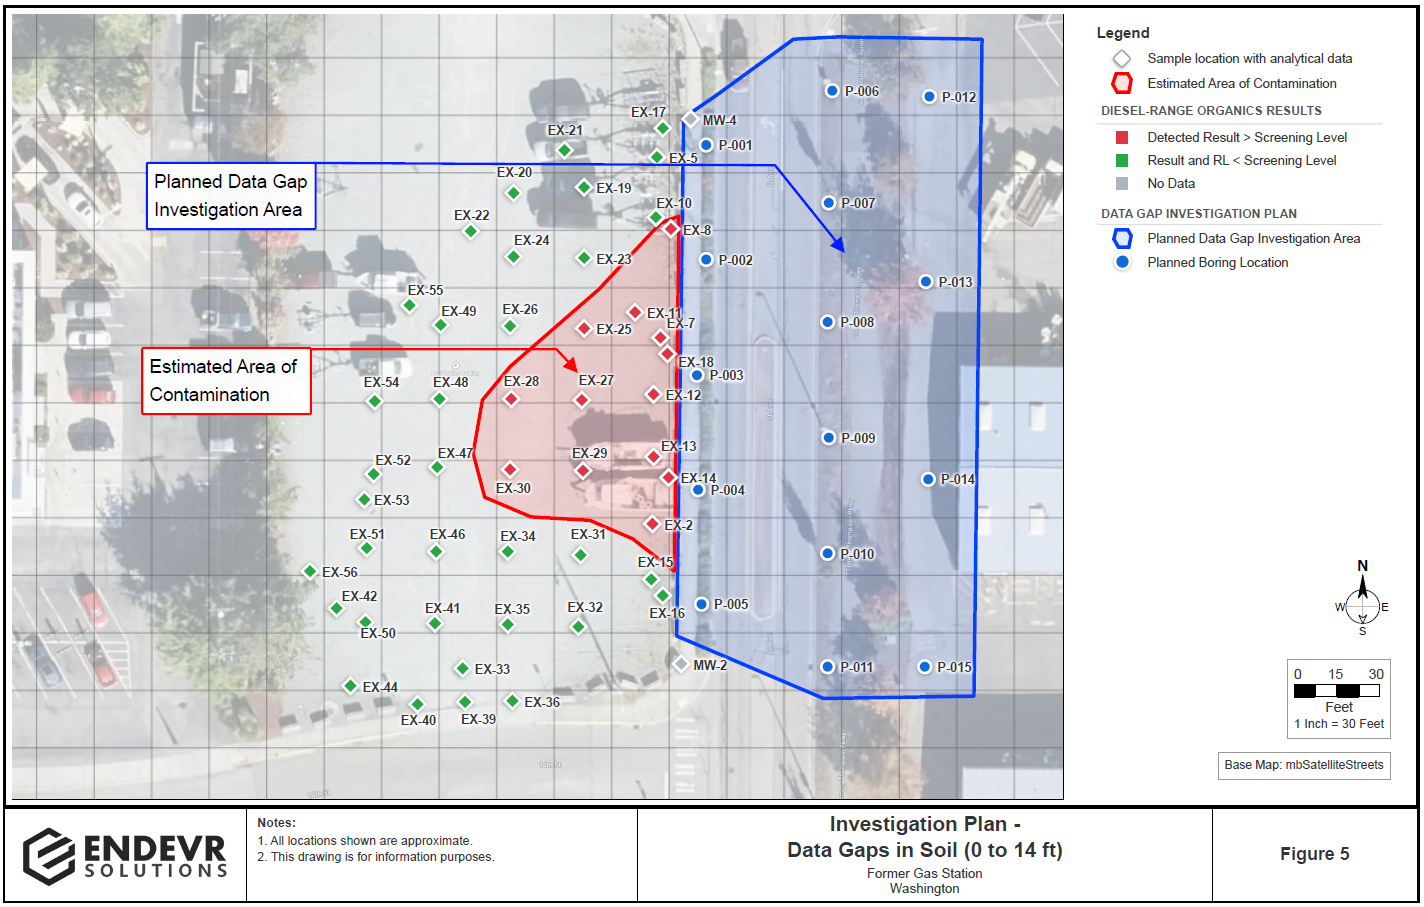 Click to enlarge
×
![]()